Introduction
Welcome to this tutorial on estimating stockpile volumes using Autodesk Civil 3D! If you’re a civil engineer, surveyor, or project manager aiming to calculate stockpile volumes accurately, you’re in the right place.
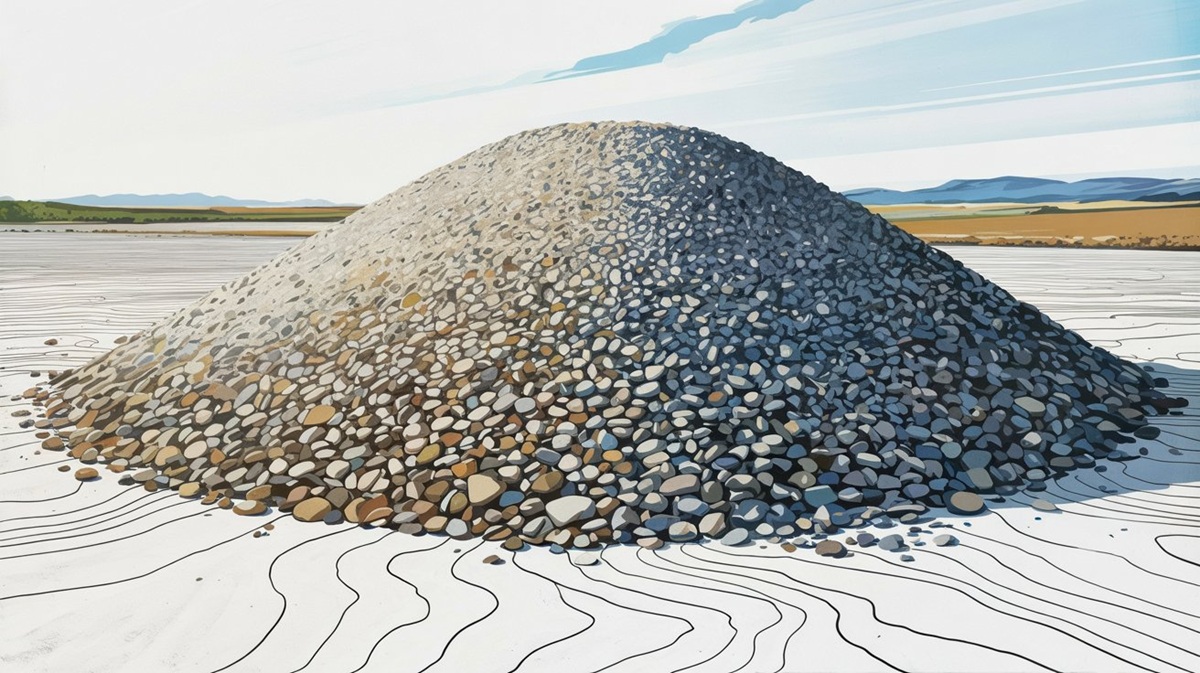
Imagine overseeing a site with a sprawling gravel pile. How much material is there? Enough for your next task, or do you need more? Accurate stockpile volume estimation drives inventory management, site planning, and cost efficiency in civil engineering, mining, and surveying.
In this tutorial, we’ll use Civil 3D to calculate a stockpile’s volume from CSV data. We’ve included a sample file, “Gravel_Stockpile.csv,” available for download (replace with your actual link). We’ll assume you’ve got Civil 3D installed and know your way around it. By the end of the tutorial, you’ll gain a practical, repeatable workflow you can apply to your own projects
Understanding Volume Estimation Concepts
Before we dive into the software, we’ll cover key concepts, then apply them step-by-step. Let’s get started!
What Is Volume Estimation?
Volume estimation compares two surfaces: the stockpile surface (the pile’s top) and a base surface (the ground below). The volume is the space between—usually “fill” for stockpiles. Civil 3D uses a Triangulated Irregular Network (TIN) to model these surfaces from point data.
How Should Data Be Captured?
For Civil 3D, you need 3D points (X, Y, Z):
- X and Y: Horizontal positions defining the footprint.
- Z: Elevation capturing height.
- Density: Points must cover the stockpile comprehensively—edges, slopes, and peak—with enough density for accuracy. Too few points distort the TIN; a dense grid or survey pattern works best.
- Methods: GPS, total stations, or drone photogrammetry, exported as CSV.
What Information Do We Need?
- Stockpile Points: 3D coordinates of the pile’s surface.
- Base Reference: Points for the ground or an assumed base (e.g., boundary-derived surface).Units: Consistent (e.g., meters).
- Coordinate System: Local or georeferenced—our sample is local.
The Gravel Stockpile
For this example, we have generated survey points from a python script to mimic a gravel stockpile. You can download the python script here to know what went into it. The dataset includes:
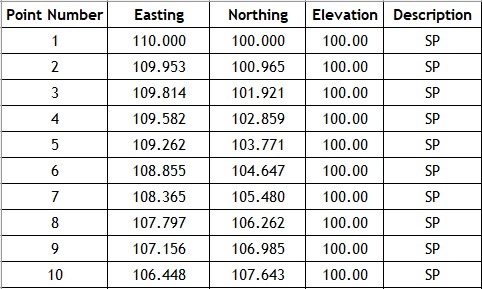
- Survey Points: 359 points in a CSV file with the following fields: Point Number, Easting, Northing, Elevation and Description.
- Shape: A conical mound, 7.5m meters high, with a 20-meter diameter base.
- Base Elevation: Flat ground with a base datum of 10 meters (simplified for clarity).
- Expected Volume: Approximately 785.40 m³ (based on the cone formula, πr²h/3, for reference).
A snippet (first few lines):
Download Sample Data: [gravel_stockpile_csv]
Importing the Gravel Stockpile Data
Let’s import the “Gravel_Stockpile.csv” sample data you downloaded:
- Start a new Civil 3D drawing. ensure the drawing unit is set to meters.
- Navigate to the Insert Tab, under the import panel click on Points from file. Select“Gravel_Stockpile.csv ,” set format to PENZD, and click OK.
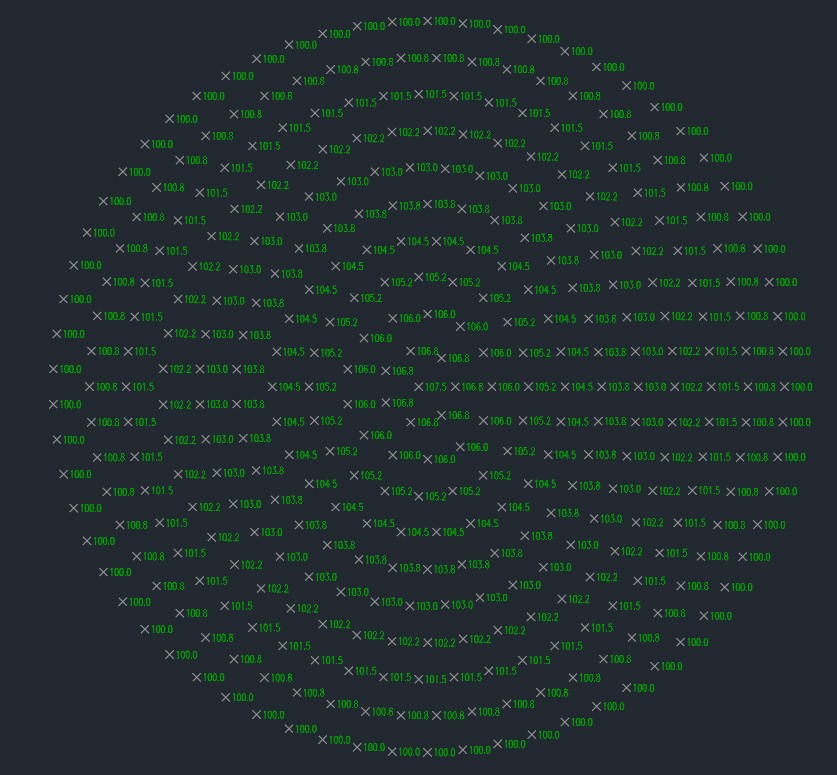
- Zoom extent to see all the imported points. Below is a screenshot my imported points. Yours may look different depending on your Civil 3D settings.
Key Note: Verify your coordinate system and units match the survey data to avoid scaling errors—a common pitfall in volume workflows.
Creating the Stockpile Surface
Let’s transform the imported points into a TIN (Triangulated Irregular Network) surface:
- In Toolspace, under the prospector tab, right-click on “Surfaces” then click “Create Surface”. Name the surface “Stockpile Surface.” Select “TIN surface”, and click OK. An empty surface will be added to the Surfaces group.
- Select the “Stockpile Surface” you just created under the “Surfaces” group, click on the plus icon next to it to expand it. This will expose additional commands for the surface. click on the plus icon next to “Definition”, right-click on “Point Groups” and click on “Add”. This will open the “Point Groups” modal window, select “_All_Points” and click Ok to add the selected point group to the surface.
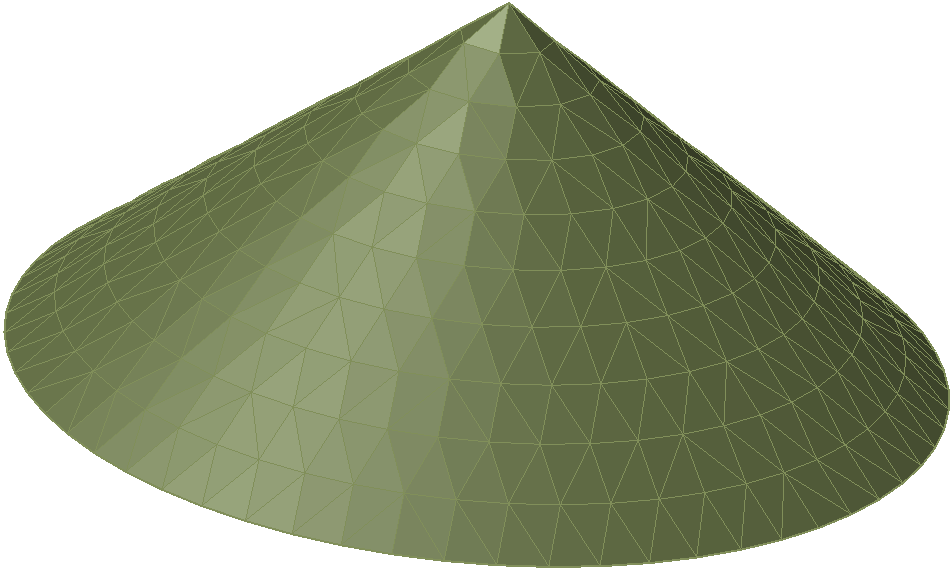
- Civil 3D will triangulates the points to create a 3D mesh. You can visualize the surface in 3D by switching to the “Object Viewer”. The image below shows the 3D mesh of the stockpile surface.
Why TIN?: It preserves the stockpile’s natural contours, unlike grid surfaces that might oversimplify. If outliers distort the mesh, edit the point group to exclude them.
Defining the Base Surface
Let’s create a base surface from the stockpile’s boundary
- Select the “Stockpile Surface”, a contextual tab exposing properties related to the selected object will open. Navigate to “Surface Tools” tab, click on the “Extract from Surface ” dropped down arrow and select “Extract Objects”.
- Check only the “border” property and click OK. Make sure all other properties are unchecked. A 3D polyline representing the boundary of the surface will be inserted into the drawing.
- In Toolspace, under the prospector tab, right-click “Surfaces” then click “Create Surface”. Name the surface “Base Surface.” Select “TIN surface”, and click OK. An empty surface will be added to the Surfaces group.
- Select the “Base Surface” you just created under the “Surfaces” group, click on the plus icon next to it to expand it. This will expose additional commands for the surface. click on the plus icon next to “Definition”, right-click on “Point Groups” and click on “Add”. This will open the “Point Groups” modal window, select “_All_Points” and click Ok to add the selected point group to the surface.
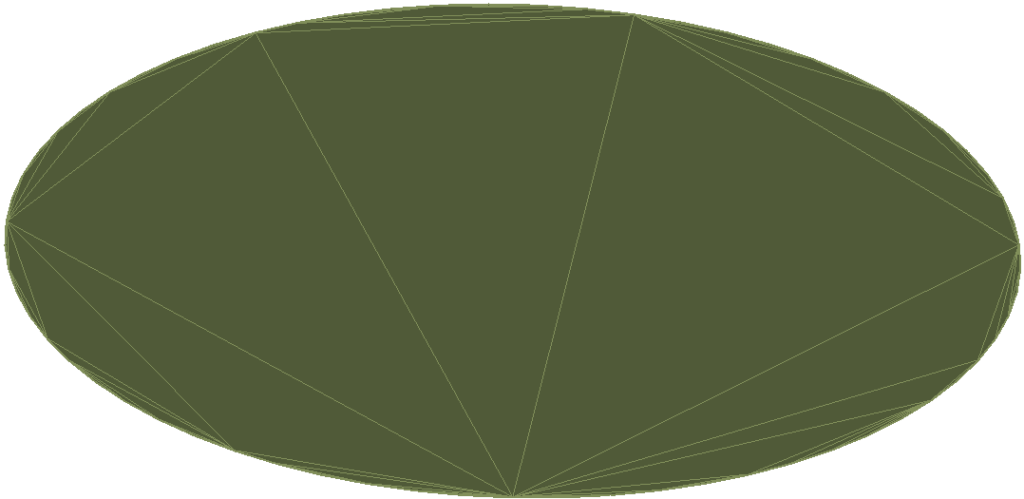
Calculating the Volume
- Volumes Dashboard: “Analyze” > “Volumes Dashboard” > “Create New Volume Surface.”
- Configure: Set “Base Surface” to “Base_Surface,” “Comparison Surface” to “Gravel_Stockpile_Surface,” name it “Gravel_Volume,” and click OK.
- Results: Expect “Cut” ≈ 0 m³, “Fill” ≈ 50-54 m³, “Net Volume” ≈ 50-54 m³. Ours hit 52.6 m³—right on target with our 52 m³ estimate!
- Verification: 52.6 m³ is within 1% of 52 m³—excellent accuracy thanks to denser points.

Best Practices
Keep it tight:
- Data Quality: Check “Gravel_Stockpile.csv” for outliers—our 150 points are clean, but real data might need fixes.
- Boundary Fit: Ensure the boundary matches the edge—tweak if off.
- Units: Match CSV and drawing units (meters).
- Save: Ctrl+S after each step.
[Image: Surface Properties dialog with breakline settings]
Nail these, and your volume’s rock-solid.
Conclusion
Wrapping Up and Looking Ahead
Great work—you’ve calculated a ~52.6 m³ gravel stockpile with “Gravel_Stockpile.csv” (download – replace with your link)! You’ve:
- Mastered volume estimation basics.
- Processed 150 points into surfaces.
- Hit a 52 m³ benchmark.
Want more? Complex bases or drone data await in our paid tutorials at [your website link]. For now, tweak this sample and sharpen your skills. You’re crushing it!